Montrose Group Launches Quality of Life Index to Measure Placemaking Success
Jamie Beier Grant
The Montrose Group LLC
The International Economic Development Council has defined placemaking as “the practice of enhancing a community’s assets to improve its overall attractiveness and livability.[i]” Often, placemaking is defined as large-scale projects like the creation of new or revitalized public spaces, alternative transportation infrastructure, pop-up retail, housing, or Downtown beautification projects. Bike trails, public beer gardens, parks, and other public spaces often mix uses and are attractive to residents and visitors alike. Successful Placemaking brings mass and density to a site but on a human scale that is walkable to ensure it is pedestrian-oriented, bikeable, and environmentally conscious. On the heels of the COVID 19 pandemic and U.S. population migration trends, the importance of Placemaking and quality of life factors to attracting talent is apparent.
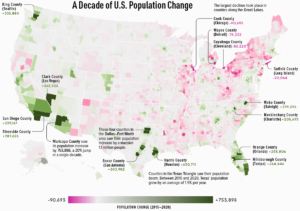
Sources: VisualCapitalist.com, U.S. Census Bureau, & USAFacts
Montrose Group has developed a Quality-of-Life Index (QLI) measure to analyze a community’s success at placemaking and, through a strategic planning process, to provide insights on what that community can do to enhance its quality of place. Montrose Group’s QLI measures seven critical community characteristics and benchmarks them to like communities to provide a community insight on how they are doing compared to their peers.
Montrose Group utilizes demographic and economic measures to determine how a community is doing at placemaking. These demographic and economic measures consider the growth or decline in crime, the availability of workforce housing, compares commute times to national averages as well as vital health statistics such as the average life expectancy of the residents in a region compared to a national average. Education levels of the residents and performance of the public schools are reviewed with higher levels of educational attainment awarded higher point totals. Finally, economic measures such as personal income, small business startups, and overall economic gains are measured.
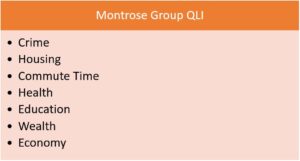
Montrose Group’s QLI relies less on traditional cost of doing business measures such as occupational wage rates, tax rates, construction and real estate costs and other traditional costs of doing business measures that drive larger manufacturing, logistics and industrial or technology based corporate site location projects. Placemaking does impact the decision of companies in these industries to locate in a region, but these efforts are not necessarily about a specific site. Many companies are more focused on the long-term prospects for a region to succeed and to be attractive to their workers to live.
A Crime Index provides a view of the relative risk of crime in a community as compared to the rest of the nation using data from resources such as the Federal Bureau of Investigation’s Uniform Crime Reporting system. According to economic theory, crime should decrease as economic growth and opportunity improve. Communities with lower crime indexes suggest higher labor force participation rates, stable wage rates, and lower risk for business operations.
Housing is an essential sector of the economy and makes up the largest component of an individual’s wealth at almost a third of the total assets.[i] Quality housing must not only be reflected in the structural aspects of a home, but also in average prices. For individuals, the lower the price, the better. For communities, the higher the price the better as property values translate into tax base. However, adequate housing can also facilitate labor mobility within an economy and as communities grow, corresponding growth of residential housing options must also keep pace. When looking at Placemaking, housing affordability and availability is key to ensuring mobile talent considers your community as a viable community to live and there is adequate housing stock to choose from.
Commute Times vary depending on the geographic locations and access to multiple modes of transportation. A diverse transportation network shortens commute times, increases company productivity and competitiveness, and increases access to a broader pool of talent. Arduous commutes may deter talent from considering jobs in a given location.[ii] As businesses look to communities with strong quality-of-life features, convenient locations and ease of travel to work by car, bike, or foot should be considered.
A Walkability Index is a nationwide geographic ranking system led by the U.S. Environmental Protection Agency. The Walkability Index uses selected variables on density, diversity of land uses, and proximity to transit to calculate the ease of walking around. Walkable communities vary depending on population and land mass (urban, suburban, rural) and take into account access to public transit.[iii]
Access to health care and services, and improving health outcomes, can demonstrate the health and wellbeing of a community. A Healthcare Index takes into account access to health care services and helps identify underperforming markets where barriers to health care, such as social, racial, economic and physical factors may exist, and where there are markets that have the services needed to support healthy living.[iv]
The strategy for communities looking to attract talent and grow population should include an analysis of Education. Educational attainment has long been a cornerstone for business retention, expansion, new business attraction, and entrepreneurship. The level of education and occupational skills found in communities traditionally correlates to demonstrated economic growth and stability. Approximately half (51.4%) of all entrepreneurs hold at least a bachelor’s degree.[v] From an individual’s perspective, higher educational attainment is generally linked to better employment prospects, higher income, and a better quality of life. And from a Placemaking and QLI standpoint, communities should maximize opportunities to attract a skilled workforce that will not only fill existing jobs but will attract new employers and generate entrepreneurial activity that will draw in new entrepreneurs and business start-ups.
Wealth in a QLI analysis takes into account education and income, however it also looks at the wealth of a community. Is a community’s tax base growing? Are property values increasing? Are homeownership rates strong? Are residents actively engaged in the workforce? While these factors are analyzed individually, collectively they paint a strong picture for Placemaking strategies that diversify and grow your community.
Similar to wealth, the economic landscape of a community is oftentimes an integrated index of multiple factors such as industry sector strengths, existing occupational skill sets, educational attainment, and growth in sales and income taxes. An analysis of a community’s Economy helps to pave the way for Placemaking strategies where communities capitalize on their competitive advantage and identify market gaps where new opportunities for business growth exist.
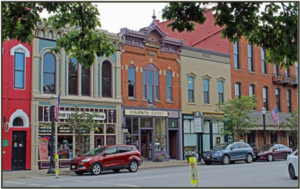
Source: Medina County Economic Development
Case Study – City of Medina, Ohio Historic Downtown District & Public Square. The city of Medina, Ohio is located 30 miles south of Cleveland and 20 miles west of Akron. The city has three distinct business districts, however the Historic District and its Victorian Era architecture, located in the city’s core, is one of Ohio’s most successful examples of downtown development. The Public Square and the buildings in the historic district surrounding the uptown park have been recognized as the physical, symbolic, commercial, governmental, cultural and social center of Medina since its founding nearly two centuries ago.[i] Today, the city’s historic center defines the image of the community and small businesses and entrepreneurs line the perimeter of Public Square and include up-scale and casual dining, fine wine and local brew options, and a nostalgic toy shop. Upper floor residential housing compliment first floor retail and office, and four museums within the Historic District offer cultural amenities to residents and visitors alike.
Demographic Overview – City of Medina, Ohio
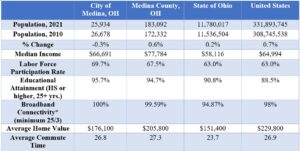
Source: U.S. Census Bureau and *Connected Nation
Despite a slight decline in population between 2010 and 2021, the city of Medina has strong demographics when it comes to a higher median income, exceptional Broadband connectivity, competitive home values, and average commute times as compared to state and national averages. These key indicators suggest an opportunity to attract new residents and talent and developers will be looking at markets such as Medina to invest.
As discussed previously, key Quality of Life Index measures demonstrate the attractiveness of communities like Medina. Medina’s Public Square district has benefitted from diverse investments in historic redevelopment, mixed-use development, and museums. Considering various QLI factors helps reinforce the momentum and attractiveness in Medina, such as factors like a Walkability Index of 12.17 which scores the district as an above average walkable community with easy access to employment and commerce areas; an above average Healthcare Index suggesting adequate access to health care resources; a low Crime Index suggesting safety; Housing Affordability below county and national averages and announcements of new housing stock coming online; and Broadband infrastructure Connectivity that supports the backbone of information access to business, employees, WFH employees, and residents alike.

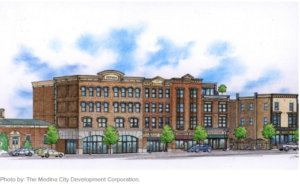 Medina’s QLI ratings around the Historic District and Public Square make the community an attractive location for continued reinvestment. Most recently, the city of Medina and Medina City Development Corporation announced a new, four-story mixed-use space that will bring 9,100 square feet of ground-level retail and three floors of 39 loft-style apartments into the historic district. The new $9.3 million investment, Liberty View, will be constructed in a 19th Century architectural style to provide continuity with surrounding Historic District properties.
The exceptional nature of Medina’s historic downtown district and Public Square have served as a catalyst for surrounding economic development investments and in 2021 alone, the county attracted $263 million in new capital investment, 362 new jobs, and over 542,000 square feet of space absorbed. In addition to new capital investment, more than $373 million in new consumer spending was generated in sectors such as housing, education, food and beverage, manufacturing, transportation, retail and entertainment, healthcare, and financial services.[i]
In summary, the Montrose Group utilizes numerous demographic and economic measures to determine how a community is doing at Placemaking. These demographic and economic measures consider the growth or decline in crime, the availability of workforce housing, compares commute times to national averages as well as vital health statistics such as the access to health care and average life expectancy of the residents in a region compared to a national average. Education levels of the residents and performance of the public schools are reviewed with higher levels of educational attainment awarded higher point totals. Finally, economic measures such as personal income, small business startups, and overall economic gains are measured to generate an overall QLI assessment that assists companies with their site location decisions. As companies shift their approach to site location, communities must also look at how Placemaking is driving economic and workforce development priorities.
Please contact Jamie Beier Grant at jbgrant@montrosegroupllc.com to discuss how the Montrose Group can assist your organization with your community or company’s economic development planning services. To read the Montrose Group’s Placemaking White Paper, visit https://montrosegroupllc.com.
[i] https://www.medinacounty.org/medina-county-economic-development-corporation/about-mcedc-rev/mcedc-impact-on-medina-county/.
[i] https://www.mainstreetmedina.com/historic-medina.html.
[i] https://www.imf.org/en/News/Articles/2015/09/28/04/53/sp060514.
[ii] https://www.bloomberg.com/news/articles/2021-07-01/invest-in-transportation-for-economic-growth.
[iii] Ibid.
[iv] https://www.esri.com/en-us/industries/health/focus-areas/access-to-care.
[v] https://www.kauffman.org/entrepreneurship/reports/educational-attainment-of-business-owners/#:~:text=Highlights%20include%3A,among%20Asian%20entrepreneurs%20(29.6%25).
[i] https://www.iedconline.org/index.php?src=directory&view=edrp_publications&submenu=EDRP&srctype=detail&back=edrp_publications&refno=669.
OEDA Congratulates Graduates of the 2025 Ohio Basic Economic Development Course
OEDA Congratulates Graduates of the 2025 Ohio Basic Economic Development Course DUBLIN, OH – The Ohio Economic Development Association (OEDA) proudly congratulates the more than 85 participants who successfully completed the 2025 Ohio Basic Economic Development Course...
OEDA Begins Strategic Planning Amid Record Growth + Program Expansion
FOR IMMEDIATE RELEASE RFP now open for OEDA’s next strategic plan; proposals due July 1, 2025 COLUMBUS, OH; Tuesday, June 3, 2025 — The Ohio Economic Development Association (OEDA) has released a Request for Proposals (RFP) to develop a new strategic plan, its first...
OEDA seeks host communities for its Annual Summit
For Immediate Release OEDA seeks host communities for its Annual Summit For the first time, location proposals sought for 400+ attendee conference COLUMBUS, OHIO – TUESDAY, NOVEMBER 12 – Today, the Ohio Economic Development Association (OEDA) announced that is...